The UK Publishing Industry in 2025
Recently I’ve been doing some research on the size and scope of the UK book and journal publishing industry, based on data from Companies House. This research is a preparatory step towards building a database of companies, highly relevant for my work as an independent consultant and as policy advisor for the Independent Publishers Guild, which represents over 600 book and journal publishers of all sizes. The other trade body, the Publishers Association lists 168 members at the time of writing, particularly larger, corporate publishers—though there is some overlap between the two organisations’ memberships. The UK publishing sector is world leading, representing over £7 billion of revenue, and it represents the bulk of my client base. So it’s worth understanding.
Executive Summary
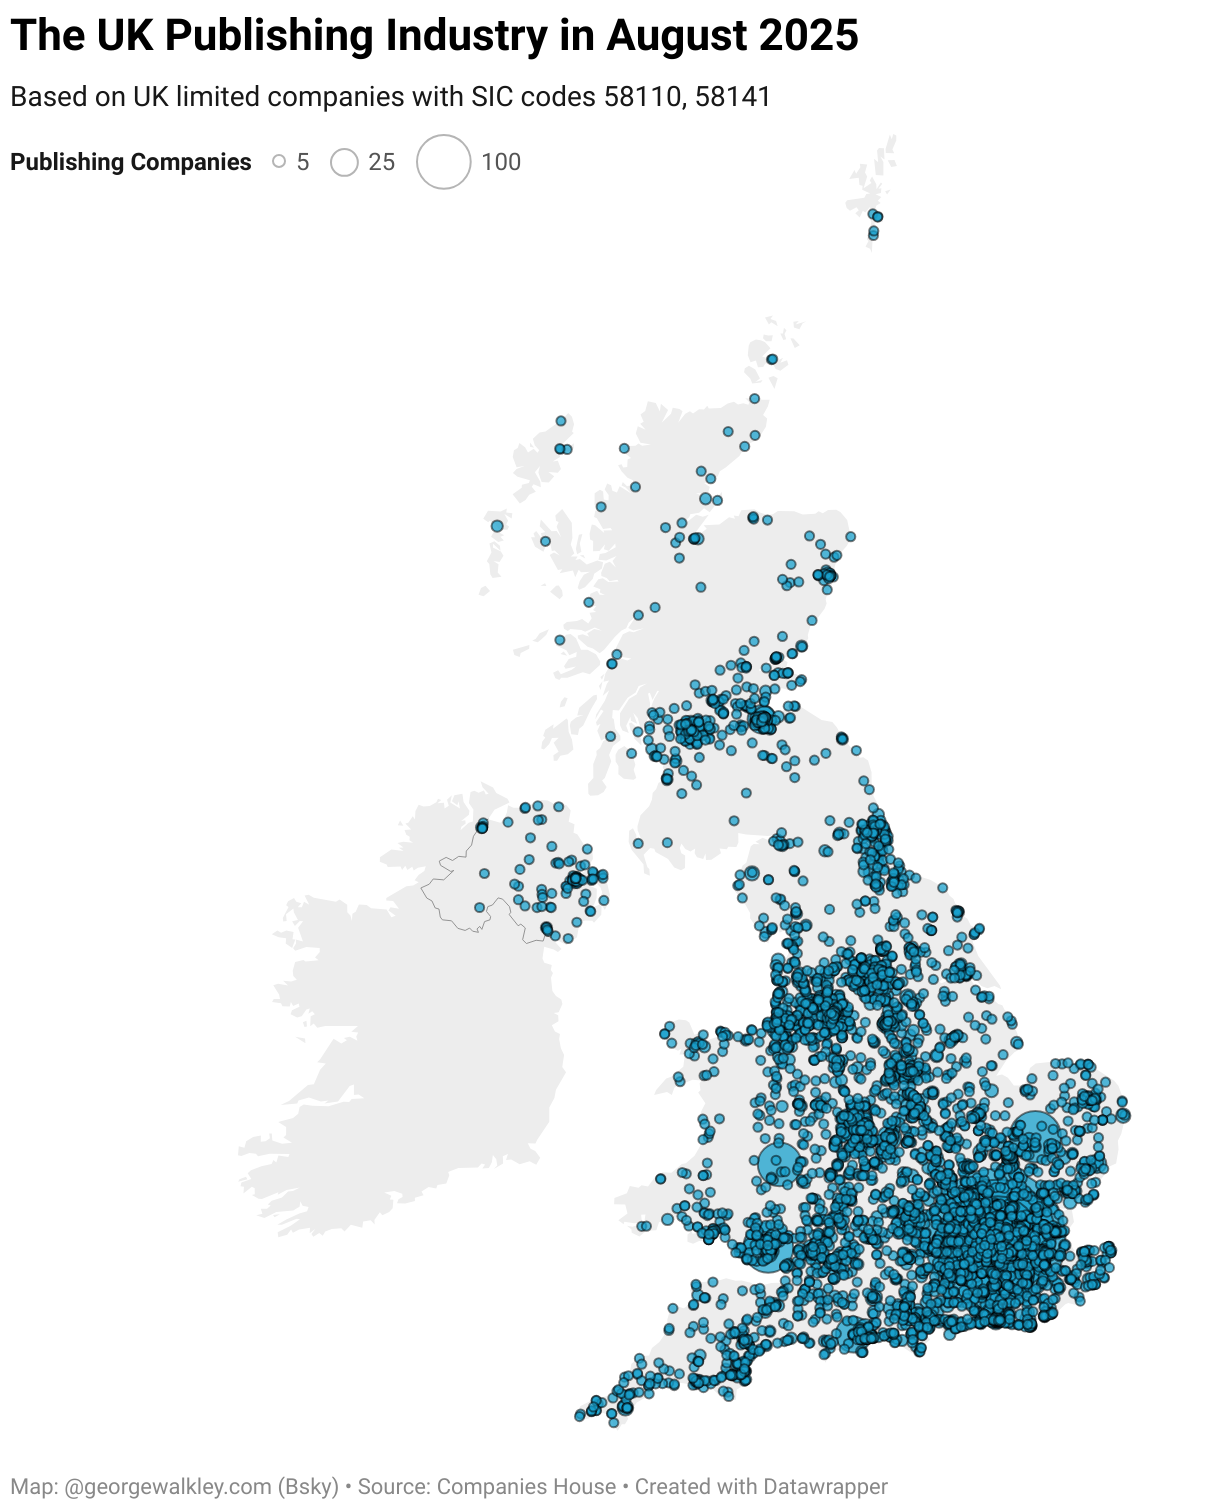
The sector is much larger in terms of population than trade association membership would suggest (albeit that book sales are concentrated in a relatively small number of publishers). I found data on over 11,000 active UK publishing businesses and plotted them geographically. This figure includes both traditional publishers and individual, self-published authors. The data skews overwhelmingly to small and medium size enterprises, with fewer than 150 publishers in the largest size bracket. The number of publishing businesses has grown by an order of magnitude since the turn of the millennium. For 2023, 2024 and 2025 YTD there have been more than 1,000 new company formations each year. And while publishing is particularly concentrated in London, the South East and major cities, companies are spread across the UK—in fact, when I cross-referenced publishing companies with parliamentary data, I found that there is not a single MP in the UK without at least one publishing business registered in their constituency.
If you’d like to go beyond the basic map and conclusions, I discuss below the methodology used, population analysis, geographic distribution of publishers and company formation trend.
Thanks to my brother Henry Walkley and friend Alex Boden, founder of data intelligence firm Asymmetrix for reading this post in draft and making valuable comments.
Methodology
Companies House is one of the wonders of the world when it comes to the public availability of corporate data. Company registration data is available via API or .csv data download (one file, or in seven smaller parts). Either way, Python is the starting point for analysis: the data .csv is too large to open in Excel, and working manually with seven separate files would be impractical (however, the smaller extracts were useful for testing the Python outputs versus Excel filtering to check that the outputs were accurate). I used ChatGPT o4-mini-high to vibecode Python scripts based on my instructions—I’m not a great coder, but I can describe a process and output clearly. The results were pretty good: a couple of times, the scripts threw errors, but pasting those back into the model and developing the scripts resolved all the issues. As the role of the LLM was writing a script for testing, and the actual analysis was carried about using a validated Python script, outputs were consistent and repeatable, with no risk of hallucination.
Limited companies specify one or more Standard Industrial Classification (SIC) codes to describe their activities: for this exercise I selected companies claiming at least one of SIC codes 58110 – Book publishing and 58141 – Publishing of learned journals. These codes are self-declared by the registrant and there may be some inaccuracy in the data, but they are the best starting point. I considered adding 58190 - Other publishing activities, but this was a particularly messy code that probably included some book and journal publishing, but also just about every other media format.
Outputting just those companies using one of those SIC codes resulted in an extract of 12,150 companies. Once I had this, I worked on a second Python script to generate monthly delta files so I can keep my dataset updated with new company formations and changes to status. The outputs from both scripts are small enough that I can work with them in Excel, at least for an experimental phase (down the road, I will automate repeated analysis in Python).
Finally, I wanted to be able to plot the initial results on a map. A third Python script consolidated the Companies House data by postcode and number of companies. For the visualisation, ChatGPT recommended a platform called Datawrapper. This worked well initially but twice failed to convert the complete list of 8,000+ postcodes into latitude and longitude data which it required for plotting. So, I went back to vibecoding in Python and prompted a short script which passed the location data to a free API, postcodes.io, and obtained latitude and longitude from there. This worked for 99%+ of the postcodes but identified a small number of errors which I corrected manually. Datawrapper imported the postcodes.io data without any issues, and it took about ten minutes of playing around with settings to configure and publish the interactive map above.
All told, this took less than three hours, including planning, experimentation and testing; an experienced Python developer would have got through it significantly faster. But it’s a good illustration of what can be done with a clear idea of the end product, an AI model and some experimentation.
Population Analysis
Of the 12,150 companies identified, 11,446 are listed as active—that is, not in Administration, Liquidation or Voluntary Agreement. The data is based on UK limited companies only, so it could possibly understate the total population: theoretically a publisher could set up as a sole trader. On the other hand, the data may also include businesses that have been categorised incorrectly, or authors setting up a limited company for their publishing income. With time and additional data, there is considerable scope to improve the raw data.
The Companies House data extract doesn’t include financial metrics such as turnover. But we can arrive at a preliminary, directional segmentation of the industry based on the type of accounts filed and the published criteria for them.
- Micro-entities are the largest single category: 4,391 businesses. These are defined as meeting two of the following criteria: turnover ≤ £632,000, balance sheet total ≤ £316,000 and ≤ 10 employees.
- Small businesses (including the Unaudited Abridged, Audit Abridged, Audit Exception, Small, Filing Exemption and Total Exemption Full) represent another 2,429 publishers. These are larger than the micro-entity threshold, and meet at least two of: turnover ≤ £10.2 million, balance sheet total ≤ £5.1 million, and ≤ 50 employees.
- Medium businesses meet at least two of turnover ≤ £36 million, balance sheet total ≤ £18 million, and ≤ 250 employees. But this category hardly exists, with only three businesses filing at this level.
- Publishers filing Group and Full accounts represent another 141 businesses. Theoretically, a group of companies could fall into one of the lower size bands, but it’s not possible to judge their exact size without follow-up. Publishers in this segment fill full, audited accounts so it will be possible to update this preliminary segmentation.
- Dormant businesses account for a further 1,790.
- Finally, 2,692 publishers have not filed accounts yet. Some may be delinquent, but most of this segment is startup businesses that haven’t hit their first filing deadline. The size of this segment introduces an interesting point about company formations which I come back to below.
Overall, the distribution of companies is about as I would have expected: a small number of very large businesses, a significant long tail of smaller enterprises, and not much in between. Though it’s even starker than I would have thought. It wasn’t always this way: earlier in my career, a senior colleague described companies in the now minuscule medium-sized segment as the ideal target for acquisition. One theory is that now there’s nothing much left to acquire at that scale, and major publishing groups’ M&A activity has moved on to on smaller companies, which thus don’t get the opportunity to scale to medium or larger scale. Another is that it’s got harder for smaller businesses to scale (I talk about this in the context of size of market below). Examinining the factors behind this would be an interesting topic for follow-up research.
Geographic Distribution
The map of UK publishers is unsurprising in showing an industry that skews to London, the South East and academic centres such as Oxford and Cambridge. But there are some caveats to note with this.
Companies House shows the registered office postcode for a business, not its trading address. The top four postcodes—WC2H 9JQ, EC1V 2NX, N1 7GU and EC2A 4NE—are all serviced office/forwarding addresses in London, representing over 1,400 publishers between them, though those businesses may actually operate outside the capital. Similarly, HR5 3DJ (Kington in Herefordshire) is not some hitherto unknown publishing centre, but the location of a single forwarding address provider. Nor is CF14 8LH (Cardiff), where numerous publishers have a standard Companies House address as their registered office, often when a previous address has been deemed invalid by the registrar.
A single registration postcode also fails to recognise the full geographic scope of multi-site businesses: for example, my old employer Hachette UK’s registration is at EC4Y 0DZ and the mapping doesn’t capture their regional offices in Edinburgh, Newcastle, Manchester, Sheffield, Bristol, Didcot and Chichester.
Finally, there is considerable variance in the area covered by a single postcode. The map data uses the centre of postcodes for plotting. While an urban postcode might represent less than 0.1 km² —in fact sometimes an individual building—a rural postcode could represent several orders of magnitude more area, making some parts of the map look more sparsely populated.
Keeping this in mind, while the industry is certainly skewed to London and other cities, publishing touches the entire country. In fact, when I cross-referenced the postcode data with constituency data from the Office for National Statistics and They Work for You, I found that there is not a single UK Member of Parliament without at least one publishing business registered in their constituency.
Company Formations
It’s striking how far back the data set goes: eleven companies on the register were incorporated in the nineteenth century, ten of which are still active. Of course, there is a significant element of survivorship bias in the data: looking at earlier years we cannot form any reliable view of how many businesses might have been founded, only those that have survived and are still listed at Companies House. But for more recent publishers, founded within the twenty years that inactive companies remain on the register after dissolution (so they would be in the data, win or lose), we have a complete dataset, and the numbers point to vibrant startup activity.
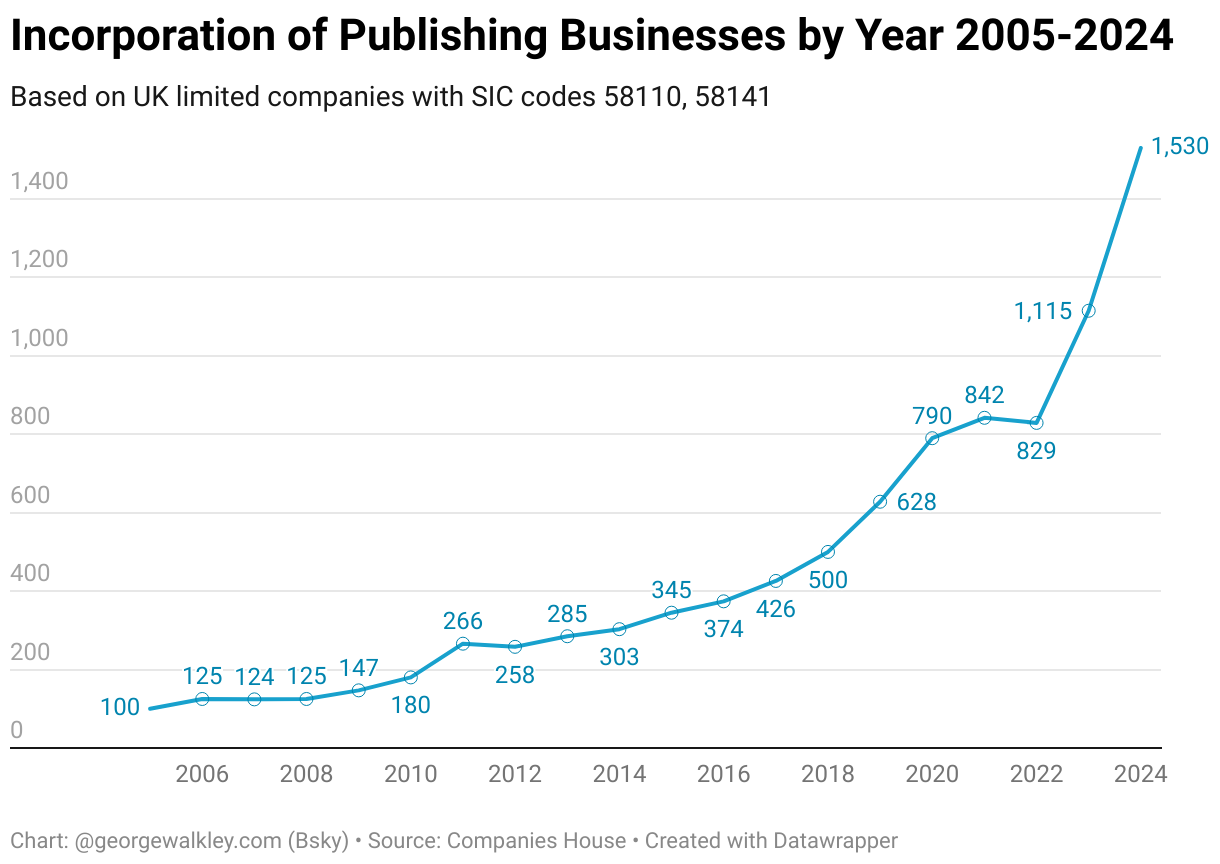
In 2005, 100 new publishing businesses were incorporated. Thereafter the rate of incorporation grows by an average 16% annually. There are leaner years in 2007 and 2008, possibly reflecting the worldwide financial crisis. In contrast, 2011 sees a bumper 48% growth in startups versus 2010. The global launch of the Kindle in late 2009 and subsequent boom in ebook sales may have had something to do with that. In 2024, more than 1,500 publishing businesses were incorporated, and on the current trend, 2025 should be another year of growth, with over 1,100 publishing businesses formed already this year. Speculatively there are various factors which could be driving this growth: declining capital barriers to entry; print-on-demand and digital distribution channels; more authors self-publishing; mergers and acquisitions, consolidation and job losses in major corporates. Again, drivers of entrepreneurship in publishing would be an interesting topic for follow-up research.
From a different perspective, there are approximately 1,200 publishing businesses in the data registered as of the turn of the millennium, rising to around 12,000 today, an order of magnitude increase. Over a similar period, the total UK population of UK businesses grew by just under 60%.
Of course, it’s important to put this in context: over the same period, UK publishing revenue has not grown commensurately. In 1999, publishing industry revenue was about £4.4 billion. The 2024 figure of £7.2 billion is up 63% in nominal terms, but in real terms (that is, adjusted for the effect of inflation) the industry actually contracted by about 12%. So the industry has got larger in population terms and smaller in terms of revenue, underlining what a challenging competitive environment publishers face.
Next Steps
With an initial dataset and a workflow for future monthly deltas, my next steps are to explore what ancillary data is available from Companies House and other open information sources. As a starter, it would be interesting to segment the data by type of publisher (trade, children’s, academic, STM) as well as refining the size segmentation.
As the dataset develops, it may be of interest to commercial entities—for strategy and corporate development, sales and marketing, competitor benchmarking and other research. If you want to start from scratch, this article shows that’s a viable option: good luck. But if you’d like to benefit from regular updates, data curation and augmentation, please do get in touch to discuss access options for the core data, or custom research and analysis.